An incredible nanoscale 3-D voyage through a tiny part of the mouse brain
July 31, 2015

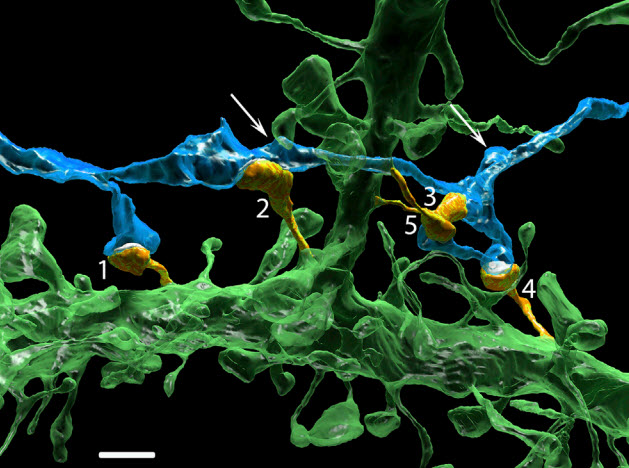
Multiple synapses of the same axon innervate multiple spines of the same postsynaptic cell. An extreme example in which one axon (blue) innervates five dendritic spines (orange, labeled 1–5) of a basal dendrite (green) is shown. Arrows point to other varicosities (swellings) of this axon that are innervating dendritic spines of other neurons. Scale bar, 2 mm. (credit: Narayanan Kasthuri et al./Cell)
Using an electron microscope, researchers have peered down inside the brain of an adult mouse at a scale previously unachievable, generating dramatic color images at 3-nm-pixel resolution. The research was published Thursday July 30 in an open-access paper in the journal Cell.
Focusing on a small area of the mouse brain that receives sensory information from mouse whiskers, the researchers built a system that automatically slices a subject brain into thousands of thin 29-nm coronal brain slices (each section 1 square millimeter) and sticks them to a conveyer belt. After staining the slices to differentiate different tissues, an automated electron microscope took pictures of each slice. A computer then assigned different colors to individual structures and combined the images to produce a 3-D map.
The scientists used a program called VAST, developed by co-author Daniel Berger of Harvard and MIT, to label and piece apart each individual “object” (e.g., neuron, glial cell, blood vessel cell, etc.) using different colors, as well as smaller structures such as dendrites and mitochondria. They also created an annotated inventory of 1700 synapses.

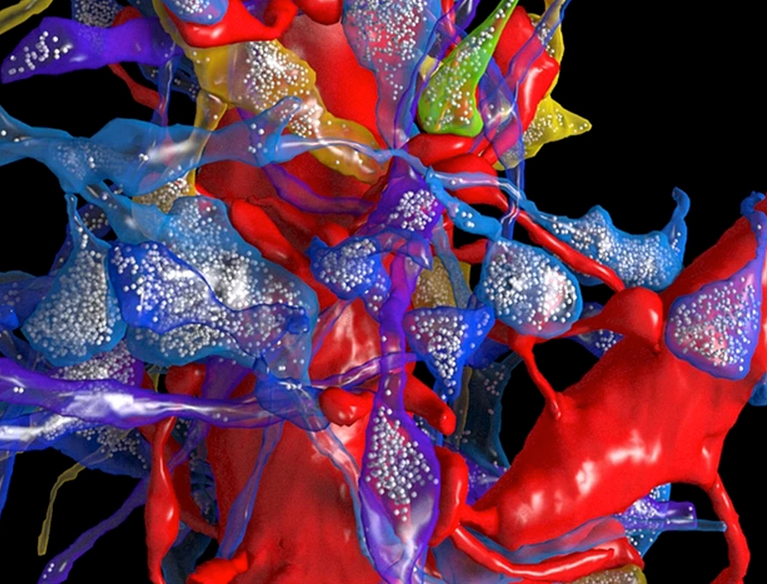
Synapses in contact with a dendrite (the large red object). The white dots are synaptic vesicles inside axons. (credit: N. Kasthuri et al./Cell)
“The complexity of the brain is much more than what we had ever imagined,” says study first author Narayanan “Bobby” Kasthuri, of the Boston University School of Medicine. “We had this clean idea of how there’s a really nice order to how neurons connect with each other, but if you actually look at the material it’s not like that. The connections are so messy that it’s hard to imagine a plan to it, but we checked and there’s clearly a pattern that cannot be explained by randomness.
“If we could make a map of a brain with schizophrenia and compare it to one without schizophrenia, we can look for inappropriate connections that may contribute to the disorder,” he said.
The cost and data storage demands for this type of research are still high, but the researchers expect expenses to drop over time (as has been the case with genome sequencing).
To allow for further inquiries and analyses in the high-resolution volume (80,000 cubic meters), scientists provide access to all of the image data via the Open Connectome Project, along with custom analytic software. They are also partnering with Argonne National Laboratory with the hopes of creating a national brain laboratory that neuroscientists around the world can access within the next few years.
Hauser Studio, Harvard University | Connections in a Cube/ Cell, July 30, 2015 (Vol. 162, Issue 3)
Abstract of Saturated Reconstruction of a Volume of Neocortex
We describe automated technologies to probe the structure of neural tissue at nanometer resolution and use them to generate a saturated reconstruction of a sub-volume of mouse neocortex in which all cellular objects (axons, dendrites, and glia) and many sub-cellular components (synapses, synaptic vesicles, spines, spine apparati, postsynaptic densities, and mitochondria) are rendered and itemized in a database. We explore these data to study physical properties of brain tissue. For example, by tracing the trajectories of all excitatory axons and noting their juxtapositions, both synaptic and non-synaptic, with every dendritic spine we refute the idea that physical proximity is sufficient to predict synaptic connectivity (the so-called Peters’ rule). This online minable database provides general access to the intrinsic complexity of the neocortex and enables further data-driven inquiries.