Biggest 3-D map of the distant universe
May 2, 2011

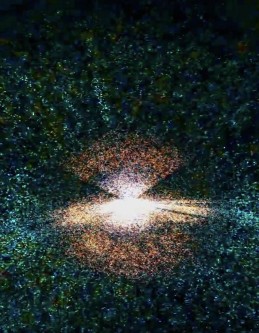
BOSS is extending the existing Sloan Digital Sky Survey map of the universe based on galaxies, center, into the realm of intergalactic gas in the distant universe, using the light from bright quasars (blue dots) (credit: Sloan Digital Sky Survey)
The biggest 3-D map of the distant universe ever made, using light from 14,000 quasars — supermassive black holes at the centers of galaxies many billions of light years away — has been constructed by scientists at the Berkeley Lab with the third Sloan Digital Sky Survey (SDSS-III).
The map is the first major result from the Baryon Oscillation Spectroscopic Survey (BOSS), SDSS-III’s largest survey. BOSS is the first attempt to use baryon acousticoscillation (BAO) as a precision tool to measure dark energy.
Baryon oscillation refers to how matter clumps in a regular way throughout the universe, a physical manifestation of the expansion of the universe.
Until now, 3-D maps showing this oscillation have been based on the distribution of visible galaxies. BOSS is the first survey to map intergalactic hydrogen gas as well, using distant quasars whose light is produced by supermassive black holes at the centers of active galaxies.
By using 14,000 of the quasars collected by the Sloan Telescope at Apache Point Observatory in New Mexico during the first year of BOSS’s planned five-year run, the new map demonstrates that it is possible to determine variations in the density of intergalactic hydrogen gas at cosmological distances and thus to measure the effects of dark energy at those distances.

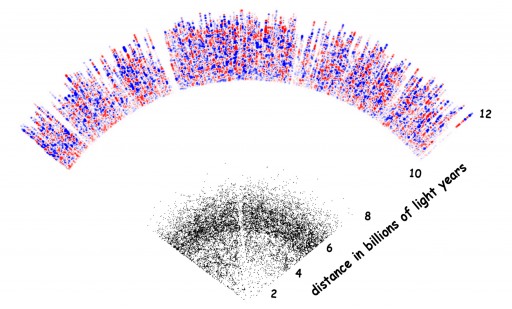
A 2-D slice through BOSS’s full 3-D map of the universe to date. The black dots going out to about 7 billion light years are relatively nearby galaxies. The colored region beginning at about 10 billion light years is intergalactic hydrogen gas; red areas have more gas and blue areas have less. The blank region between is inaccessible to the Sloan Telescope, but the proposed BigBOSS survey would be able to observe it. (Credit: Anže Slosar and BOSS Lyman-alpha cosmology working group)
Over its five-year extent, BOSS is using two distinct methods to calibrate the markings on the cosmic yardstick: precisely measure 1.5 million luminous red galaxies at “low” redshifts around z = 0.7 (z stands for redshift); and (eventually) measure the Lyman-alpha forest (the hydrogen spectrum of a distant quasar) of 160,000 quasars with high redshifts around z = 2.5. These redshifts correspond to galaxies at distances of 2 to 6 billion light years and quasars at 10 to 11 billion light years.

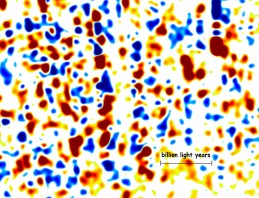
Zooming in on the map slice shows areas with more gas (red) and less gas (blue) as revealed by correlations of the Lyman-alpha forest data from the spectra of thousands of quasars (credit: Anže Slosar and BOSS Lyman-alpha cosmology working group)
The wide-field Sloan Telescope covers a wide expanse of sky at moderate magnification. To measure both galaxies and quasars, a thousand targets for each BOSS exposure are selected in advance from existing surveys. At the telescope’s focal plane, “plug plates” are precision-machine-drilled with tiny holes at positions of known galaxies and quasars.
These holes are plugged with optical fibers that channel the light from each chosen galaxy or quasar to a spectrograph, which isolates the spectrum of each individual object.
“By the time BOSS ends, we will be able to measure how fast the universe was expanding 11 billion years ago with an accuracy of a couple of percent,” says Patrick McDonald of Berkeley Lab and Brookhaven, who pioneered techniques for measuring the universe with the Lyman-alpha forest.
“Considering that no one has ever measured the cosmic expansion rate so far back in time, that’s a pretty astonishing prospect.”
The huge new map was presented at the April meeting of the American Physical Society in Anaheim, CA by Anže Slosar of Brookhaven National Laboratory.