Culturomics 2.0: Forecasting large-scale human behavior using global news media tone in time and space
September 26, 2011 | Source: First Monday

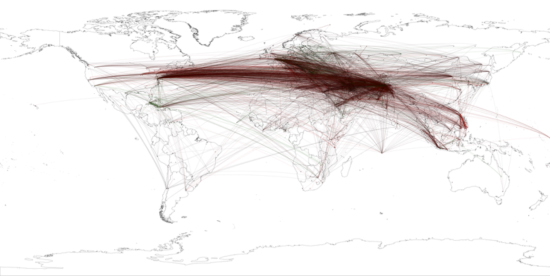
Global geocoded tone of all Summary of World Broadcasts content January 1979–April 2011 mentioning “Bin Laden” (click to view animation). (Credit: UIC)
Computational analysis of large text archives can yield novel insights into the functioning of society, recent literature has suggested, including predicting future economic events, says Kalev Leetaru, Assistant Director for Text and Digital Media Analytics at the Institute for Computing in the Humanities, Arts, and Social Science at the University of Illinois and Center Affiliate of the National Center for Supercomputing Applications.
The emerging field of “Culturomics” seeks to explore broad cultural trends through the computerized analysis of vast digital book archives, offering novel insights into the functioning of human society, while books represent the “digested history” of humanity, written with the benefit of hindsight. People take action based on the imperfect information available to them at the time, and the news media captures a snapshot of the real-time public information environment.
But news contains far more than just factual details: an array of cultural and contextual influences strongly impact how events are framed for an outlet’s audience, offering a window into national consciousness. A growing body of work has shown that measuring the “tone” of this real-time consciousness can accurately forecast many broad social behaviors, ranging from box office sales to the stock market itself .
Case in point: applying tone and geographic analysis to a 30–year worldwide news archive, global news tone is found to have forecasted the revolutions in Tunisia, Egypt, and Libya, including the removal of Egyptian President Mubarak; predicted the stability of Saudi Arabia (at least through May 2011); estimated Osama Bin Laden’s likely hiding place as a 200–kilometer radius in Northern Pakistan that includes Abbotabad; and offered a new look at the world’s cultural affiliations.
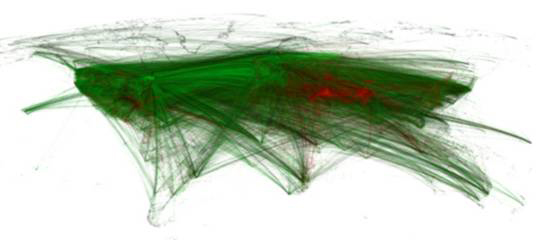
Clicking on the image below will open an animated GIF movie showing each year in sequence for the world over the last half century. Each city or other geographic landmark (such as islands, oceans, mountains, rivers, etc) is color-coded on a 400-point scale from bright green (high positivity) to bright red (high negativity), based on the average tone of all articles mentioning that city.
