First comprehensive roadmap of the mammalian brain
April 3, 2014

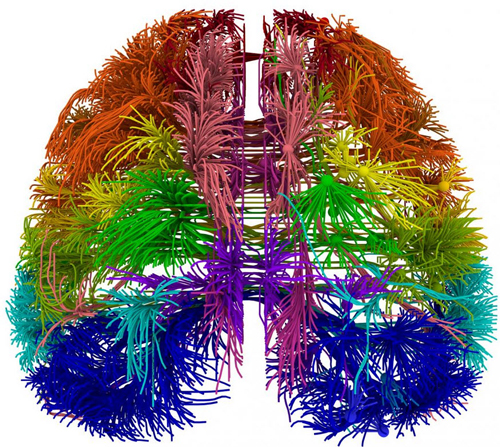
A top-down 3-D view of connections originating in different cortical areas of the mouse brain (credit: Allen Institute for Brain Science)
Researchers from the Allen Institute for Brain Science have published the Allen Mouse Brain Connectivity Atlas, the first comprehensive, large-scale data set on how the brain of a mammal is wired, described in their paper in Nature.
The mouse brain’s 75 million neurons are arranged in a structure roughly similar to the human brain’s approximately 100 billion neurons, so they provide a powerful model system for understanding how nerve cells of the human brain connect, process. and encode information, say Allen Institute researchers.
(The only species for which we have a complete wiring diagram is the simple microscopic worm C. elegans — a far simpler system, with only 302 neurons.)
Scientists at the Allen Institute set out to create a wiring diagram of the brain—also known as a “connectome” — to illustrate short and long-range connections, using genetically engineered viruses to trace and illuminate individual neurons. To get a truly comprehensive view, scientists collected imaging data at resolutions smaller than a micron (millionth of a meter) from more than 1,700 mouse brains, each of which was divided into 140 serial sections.
“The data for the Allen Mouse Brain Connectivity Atlas was collected in a way that’s never been done before,” says Zeng. “Standardizing the data generation process allowed us to create a 3D common reference space, meaning we could put the data from all of our thousands of experiments next to each other and compare them all in a highly quantitative way at the same time.”
The Allen Mouse Brain Connectivity Atlas contains more than 1.8 petabytes of data—the equivalent of 23.9 years of continuous HD video — all of which is freely available online to the entire community. Like all of the Allen Brain Atlas resources, the data and the tools to browse and analyze them are freely available to the public at www.brain-map.org.
The Global Power of the Atlas
This movie displays 21 mapping experiments from the Allen Mouse Brain Connectivity Atlas: a tool to investigate how different regions of the brain are connected. The density of axons at each voxel (dot) are displayed as overlapping circles color-coded by the area of the brain from which the axons are projecting. This animation shows how projections from different regions of the cortex divide the thalamus and striatum into distinct domains. — Allen Institute
By analyzing the data, Zeng and her team were able to discover several interesting properties of the mouse brain’s connectome. For example, there are extensive connections across the two hemispheres with mirror-image symmetry. Pathways belonging to different functional circuits in the brain can be identified and their relationships and intersections visualized in 3D.
And there is a great degree of variation in the strengths of all the connections, ranging beyond five orders of magnitude (a 10,000 to one ratio) and an intriguing balance between a small number of strong connections and a large number of weak connections.
“The purpose of the Atlas is to create a new way to map the brain’s vast connections systematically and rapidly, and to develop a platform to present the data to users and help them navigate in the friendliest possible way,” explains Zeng. “But the kind of analysis we have done so far is just the beginning of the deep analysis of the wiring patterns of different brain circuits made possible by this unique collection of data.”
The Future of the Connectivity Atlas
Maintaining the Allen Mouse Brain Connectivity Atlas is a continuous effort. After the completion of the Atlas as originally scoped in March 2014, scientists will continue to update the Atlas with profiles of more individual nerve cell types as they become available. Researchers at the Allen Institute will also focus on studying the connections between different types of neurons in the same or neighboring regions — the city roads and local streets that, together with the interstates, form the hierarchical neural networks.
“Previously, the scientific community had to rely on incomplete, fragmented data sets, like small pieces of a map but at different scales and resolutions, so it was impossible to see the bigger picture,” explains Ed Callaway, Professor in the Systems Neurobiology Laboratories at the Salk Institute for Biological Studies. “Now, we have instant access to complete and consistent data across the entire brain, and the suite of web-based analytic and display tools make it easy to find what you need and to see it in 3D.