New 3D map of massive galaxies and black holes offers clues to dark matter, dark energy
August 9, 2012
Astronomers have constructed the largest-ever three-dimensional map of massive galaxies and distant black holes, which will help the investigation of the mysterious “dark matter” and “dark energy” that make up 96 percent of the universe.
The map was produced by the Sloan Digital Sky Survey III (SDSS-III).

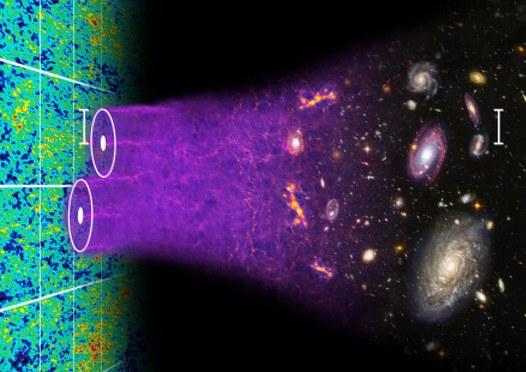
An illustration of the concept of baryon acoustic oscillations, which are imprinted (cosmic microwave background image, left) in the early universe and can still be seen today in galaxy surveys like BOSS (credit: Chris Blake and Sam Moorfield)
Early last year, the SDSS-III released the largest-ever image of the sky, which covered one-third of the night sky. The new data, “Data Release 9” (DR9), which publically releases the data from the first two years of this six-year project, begins expansion of this earlier image into a full three-dimensional map.
DR9 is the latest in a series of data releases stretching back to 2001. This release includes new data from the ongoing SDSS-III Baryon Oscillation Spectroscopic Survey (BOSS), which will eventually measure the positions of 1.5 million massive galaxies over the past seven billion years of cosmic time, as well as 160,000 quasars — giant black holes actively feeding on stars and gas — from as long ago as 12 billion years in the past.
BOSS is targeting these big, bright galaxies because they live in the same places as other galaxies and they’re easy to spot, even far away in the universe. Mapping these big galaxies thus provides an effective way to make a map of the rest of the galaxies in the universe.
Retracing the history of the universe
With such a map, scientists can retrace the history of the universe over the last seven billion years. With that history, they can get better estimates for how much of the universe is made up of “dark matter” — matter that we can’t directly see because it doesn’t emit or absorb light — and “dark energy,” the even more mysterious force that drives the accelerating expansion of the universe.
The DR9 release includes images of 200 million galaxies and spectra of 1.35 million galaxies, including new spectra of 540,000 galaxies from when the universe was half its present age. Spectra show how much light a galaxy gives off at different wavelengths. Because this light is shifted to longer redder wavelengths as the universe expands, spectra allow scientists to figure out how much the universe has expanded since the light left each galaxy. The galaxy images, plus these measurements of expansion, are combined by SDSS-III scientists to create the three-dimensional map released with DR9.
Distant “quasars” provide another way to measure the distribution of matter in the universe. Quasars are the brightest objects in the distant universe and their spectra show intricate patterns imprinted by the large-scale clumping of intergalactic gas and underlying dark matter that lies between each quasar and the Earth.
These new data are not only helping us understand the distant universe, but also our own cosmic backyard, the Milky Way galaxy. DR9 includes better estimates for the temperatures and chemical compositions of more than half a million stars in our own galaxy.
All these new images and spectra contain the promise of new discoveries about our universe, but the SDSS-III is only in the middle of its six-year survey.
Funding for SDSS-III has been provided by the Alfred P. Sloan Foundation, the Participating Institutions, the National Science Foundation, and the U.S. Department of Energy Office of Science.