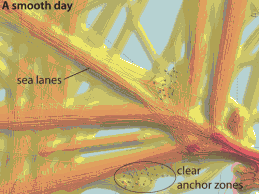
A day of shipping traffic near Rotterdam, using data from ships: darker traces signify slower speeds and color coding shows traffic density (N. Willems / H. van de Wetering / J. van Wijk / TUE)
Researchers are developing new ways to visualize information to analyze the world around us.