Largest astronomical image to date contains 46 billion pixels
October 22, 2015

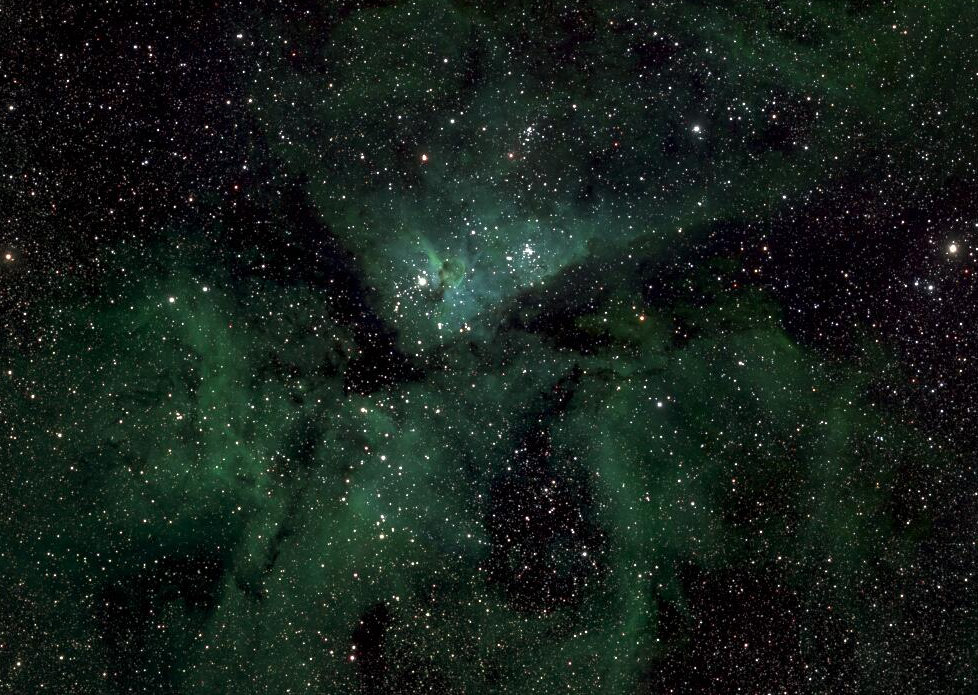
A small section of the Milky Way photo showing the star Eta Carinae (credit: Lehrstuhl für Astrophysik/RUB)
Astronomers at the Ruhr-Universität Bochum in Germany have compiled the largest astronomical image to date: a picture of the Milky Way containing 46 billion pixels, viewable here (you can enter an object name, such as “Eta Carinae,” in the lower-left box).
The image was generated over a period of five years of astronomical observations by two telescopes at Bochum’s university observatory in the Atacama Desert in Chile. It only includes objects with variable brightness, which includes stars with a planet passing in front. The area that the astronomers observed is so large that they had to subdivide it into 268 sections.

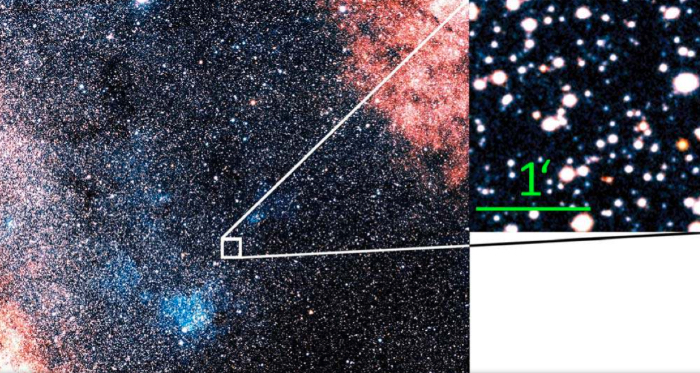
False color image of the field containing the Galactic Center (credit: M. Haas et al./Astronomical Notes)
Abstract of The Bochum survey of the southern Galactic disk: I. Survey design and first results on 50 square degrees monitored in 2011
We are monitoring a 6° wide stripe along the southern Galactic disk simultaneously in the r and i bands, using a robotic 15-cm twin telescope of the Universitätsternwarte Bochum near Cerro Armazones in Chile. Utilising the telescope’s 2.7° field of view, the survey aims at observing a mosaic of 268 fields once per month and to monitor dedicated fields once per night. The survey reaches a sensitivity from 10m down to 18m (AB system), with a completeness limit of r ∼ 15.5m and i ∼ 14.5m which – due to the instrumental pixel size of 2.″4 – refers to stars separated by >3″. This brightness range is ideally suited to examine the intermediately bright stellar population supposed to be saturated in deep variability surveys with large telescopes. To connect to deep surveys or to explore faint long term variables, coadded images of several nights reach a depth of ∼ 20m. The astrometric accuracy is better than 1″, as determined from the overlap of neighbouring fields. We describe the survey design, the data properties and our procedures to derive the light curves and to extract variable stars. We present a list of ∼2200 variable stars identified in 50 square degrees with 50-80 observations between May and October 2011. For bright stars the variability amplitude A reaches down to A ∼ 0.05m, while at the faint end variations of A > 1m are detected. About 200 stars were known tobe variable, and their amplitudes and periods – as far as determinable from our six month monitoring – agree with literature values, demonstrating the performance of the Bochum Galactic Disk Survey (© 2012 WILEY-VCH Verlag GmbH & Co. KGaA, Weinheim)
Abstract of The Bochum Survey of the Southern Galactic Disk: II. Follow-up measurements and multi-filter photometry for 1323 square degrees monitored in 2010 – 2015
This paper is the second in a series describing the southern Galactic Disk Survey (GDS) performed at the Universitätssternwarte Bochum near Cerro Armazones in Chile. Haas et al. (2012, Paper I) presented the survey design and the characteristics of the observations and data. They identified ∼2200 variable stars in an area of 50 square degrees with more than 50 observations in 2011. Here we present the first complete version of the GDS covering all 268 fields with 1323 square degrees along the Galactic disk including revised data from Paper I. The individual fields were observed up to 272 times and comprise a maximum time span between September 2010 and May 2015. We detect a total of 64 151 variable sources, which are presented in a catalog including some of their properties and their light curves. A comparison with the International Variable Star Index (VSX) and All Sky Automated Survey (ASAS) indicates that 56794 of these sources are previously unknown variables. Furthermore, we present U, B, V, r ′, i ′, z ′ photometry for all sources within the GDS, resulting in a new multi-color catalog of nearly 16×106 sources detected in at least one filter. Both the GDS and the near-infrared VISTA Variables in the Via Lactea survey (VVV) complement each other in the overlap area of about 300 square degrees enabling future comparison studies. (© 2015 WILEY-VCH Verlag GmbH & Co. KGaA, Weinheim)