Exponential Growth an Illusion?: Response to Ilkka Tuomi
September 13, 2003 by Ray Kurzweil
Ray Kurzweil responds to Ilkka Tuomi’s essays, “The Lives and Death of Moore’s Law” and “Kurzweil, Moore, and Accelerating Change,” in which Tuomi challenges Kurzweil’s “law of accelerating returns” and the exponential growth of semiconductor technology.
Published on KurzweilAI.net Sept. 23, 2003. See also The Lives and Death of Moore’s Law and Kurzweil, Moore, and Accelerating Change (pdf) by Ilkka Tuomi.
In his detailed analysis “The Lives and Death of Moore’s Law,” Ilkka Tuomi concludes that the “semiconductor industry has not actually followed an exponential growth trend” and “price decreases have not followed an exponential trend.”1
Tuomi’s conclusions are surprising, to say the least. If correct, I would have to conclude that the one-quarter MIPS computer costing several million dollars that I used at MIT in 1967 and the 1000 MIPS computer that I purchased recently for $2,000 never really existed. Tuomi has an explanation for all this. He writes that “the apparent explosive big bang in semiconductor technology is . . . an illusion.”2
If all of this is an illusion, it has been quite an effective one. The reality is that Tuomi’s conclusions defy common sense and clear observation. They are at odds with the historical data on the past, as well as all of the industry road maps for the future.
Tuomi’s approach is to set up a variety of straw men in the form of faulty interpretations of Moore’s Law and then proceed to show how certain data fail to match these incorrect interpretations. When presented with a “forest” of data representing a clear exponential trend, Tuomi often cites a tree with a missing branch (see my discussion below on Tuomi’s critique on my history of the computing trend over the past century). Tuomi supports his contrarian contentions with a list of often conflicting technical terminology and irrelevant historical anecdotes. There are a variety of misconceptions in Tuomi’s two papers, which I detail in this response essay.
Despite a plethora of misconstructions in the data that Tuomi presents, his analysis is nonetheless replete with exponential trends. Tuomi’s remarkable conclusion that the semiconductor industry has not followed an exponential trend is not consistent with his own analysis.
Tuomi repeatedly points out how the advances have not followed the oft-quoted 18-month doubling time of Moore’s Law. Tuomi is correct that the 18-month figure is a mischaracterization. Moore never said it, and it does not necessarily match the data (depending, of course, on what you’re measuring). Tuomi devotes a lot of his paper to showing how the 18-month figure is not correct, at least for certain measurements. He quotes a lot of people, such as R.X. Cringely in 1992, who have gotten it wrong3.
But the fact that many people state Moore’s Law incorrectly does not mean that there is not a correct way to state it, and it certainly does not follow that there has not been exponential growth.
Moore’s Law refers to the continual shrinking of the size of transistors on an integrated circuit, as well as other process and design improvements. This shrinking increases the number of transistors that can be placed on a chip, as well as their speed, resulting in dramatic exponential gains in the price-performance of electronics.
My law of acceleration returns is broader, and refers to ongoing exponential improvements in the price-performance and capacity of information technologies in general, of which Moore’s law is just one example. I provide further explanation and examples below.
Tuomi writes that
“During the four decades of validity often claimed for Moore’s Law the difference between one-year and three-year doubling time means about eight orders of magnitude. In other words, to get the same number of transistors, the slower growth path would require us to buy 100 million chips, instead of one.”4
I would certainly agree that there is an enormous difference in implications between a one-year and a three-year doubling time. However, there is no such variability in the data, unless one is trying to create confusion. Whether one gets a 36-month doubling time or a 12-month doubling time, or any other doubling time, depends entirely on what is being measured. If measuring something simple like two-dimensional feature size, then the doubling time (toward smaller features) is about 36 months.5
This has nothing to do, however, with cost-effectiveness or price-performance, which is what we really care about. The cost per transistor has fallen by half about every 1.6 years. If one takes into consideration all of the levels of improvement including speed, as I describe below, then the doubling time for price-performance is closer to one year.
Regardless of the doubling time, the trends are all exponential, not linear, both in the historical data, and in the roadmaps for the future. Tuomi’s point about the difference between 36 months and 12 months as a doubling time is based entirely on comparing apples to watermelons, or in this case, cell sizes to actual price-performance improvements.
Let’s examine these issues in more detail. I’ll start with my own four-plus decades of experience in this industry. Compare the MIT computer I mentioned above to my current notebook. As a student in 1967, I had access to a multi-million dollar IBM 7094 with 32K (36-bit) words of memory, and a quarter of a MIPS processor speed. I now use a $2,000 personal computer with a quarter billion bytes of RAM and about a thousand MIPS processor speed. The MIT computer was about a thousand times more expensive, so the comparison with regard to the cost per MIPS is a factor of about 4 million to one.
)
Click for larger version.
This ignores many other advantages of my contemporary computer. Ignoring these other significant factors of improvement, the contemporary computer provides MIPS of processing at a cost that is 222 lower than the computer I used in 1967. That’s 22 doublings in 36 years, or about 19 months per doubling. If we factor in the increased value of the approximately 2,000 fold greater RAM memory, vast increases in disk storage, the more powerful instruction set of my circa 2003 computer, vast improvements in communication speeds, more powerful software, and other factors, the doubling time comes down even further.
Consider microprocessor history. The Intel 8080 had 5,000 transistors in 1974. The Pentium IV had 42 million transistors in 2000. That’s just about exactly 13 doublings in 26 years, which is a two-year doubling time. Keep in mind that this two-year doubling time takes into consideration only this single factor of the number of transistors. If we also factor in the fact that the smaller Pentium IV transistors operate many times faster and are organized with many layers of circuit innovation, then the overall price-performance improvement is greater than 213. The graph (of number of transistors) of the intervening processors (such as 8086, 286, 386, 486, Pentium, Pentium 2, etc.) shows smooth exponential growth (R2 = 0.9873).6
![]()
Click for larger version
We should also keep in mind that adding transistors to a microprocessor is not the sole or even the primary goal of semiconductor technology. At a certain point in the future, we will have the optimal complexity for a single processor. We will continue to want to improve price-performance, but not necessarily number of transistors in a single microprocessor. Thus the International Technology Roadmap for Semiconductors (ITRS) projects the number of transistors in a single microprocessor to double every 36 months through 2016, but also projects the cost of a single microprocessor to come down such that the cost per transistor in a microprocessor is coming down by half every 24 months. Even this figure ignores the speed improvement factor, which I discuss below.
Data from Dataquest and Intel shows that the average price of a transistor per year went from 1 dollar in 1968 to about 2 x 10⁻⁷ dollars in 2002. That represents an improvement of 5 x 10⁶ (= approximately 222) in 34 years. This represents 22 doublings in 34 years, or about 1.6 years per doubling. Again, the trend has been very smooth in intervening years.7
![]()
Click for larger version
Keep in mind that unlike Gertrude Stein’s roses, it is not the case that a transistor is a transistor. Because transistors have been getting steadily smaller (at an exponential rate), they have been getting faster, so this factor brings down the doubling time for price-performance even further. And there are other levels of innovation that also improve price-performance.
The available data also supports exponential growth in volumes. The number of transistors shipped, according to Instat/MDR, went from 2 x 10⁹ in 1968 to just under 1018 in 2002, or an increase of about 4 x 10⁸ (= 229) in 34 years. This represents a doubling time of 1.1 years.8 Again, this ignores other levels of improvement.
)
Click for larger version
Now let’s factor in the speed improvement. Interestingly, Tuomi provides us with this exponential trend in his paper9:
Tuomi’s Figure 4: Desktop computer processor speed.
Source: Berndt et al., 2000, Table 1.
It is difficult to see the exponential trend in Tuomi’s linear chart, so I provide here our own logarithmic chart of microprocessor clock speed, which shows both the historical data and the ITRS road map10:
)
Click for larger version
With a speed improvement of approximately 103 in 34 years (1968 to 2002), the cost per transistor cycle decreased by a factor of 5 x 10⁹ (= 232), resulting in a doubling time of just over 12 months.11 Even this analysis takes into consideration only semiconductor density and process improvements, and does not take into consideration improvements at higher levels such as processor design (for example, pipelining, parallel instruction execution, and other innovations).
![]()
Click for larger version
The theoretical total number of transistor cycles in the world increased by a factor of 4 x 10¹¹ (= 239) in 34 years, resulting in a doubling time of only 10.4 months.
One could go on for many pages with such analyses, measuring many different dependent measures, and citing data from many sources, all of which show clear exponential growth. Tuomi’s myopic finding that there is no exponential growth in the semiconductor industry is notable, and I admire his tenacity in attempting to prove that the world of information technology is flat (i.e., linear).
One reason technology improves exponentially is that we seek to improve quantifiable measures by multiples rather than by linear increments. About a half century ago, Dr. An Wang and his engineers struggled to add an increment of a thousand bits to his (iron-core-based) RAM storage. Do engineers struggle to add a thousand bits to a memory design today? Or a million bits? Design goals today are more likely to be measured in billions of bits. Goals are always set in a multiplicative relation to the current standard.
Another reason that technology improves exponentially is that we use the (more) powerful tools of one generation of technology to create the next. Early computers were designed pen-on-paper and wired with individual wires and screwdrivers. Today, a chip or computer designer specifies formulae and high-level parameters in a high-level language, and many layers of intermediate design are automatically computed by powerful computer-assisted-design software systems.
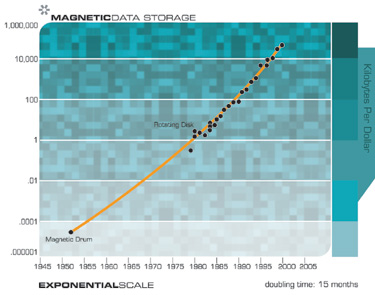
For these and related reasons, we see exponential growth not only in memory and computational price-performance, but across the board in information-related technologies. For over two decades, I have been studying key measures of capacity and price-performance in a wide variety of such technologies. The data clearly shows exponential growth that goes far beyond Moore’s Law or computation. We see exponential growth in a broad variety of measures of the capacity and price-performance of information technologies. To provide just a few examples, consider the price-performance of magnetic-disk memory density, which is a phenomenon distinct from semiconductors12:
The Internet13:
)
Click for larger version
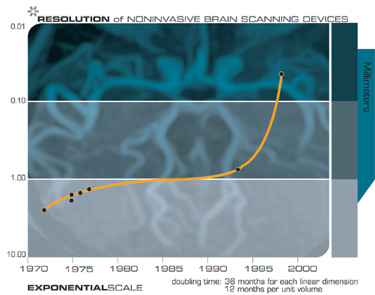
Brain scanning14:
Biological technologies such as DNA sequencing15:
)
Click for larger version
We also see exponential growth in varied measures of human knowledge, and even in the key feature sizes of technology, both electronic and mechanical.16 Tuomi himself adds to our extensive list of examples of exponential growth in information when he writes, “According to Price (1986), the number of scientific journals has doubled about every 15 years since 1750, the number of ‘important discoveries’ has doubled every 20 years, and the number of U.S. engineers about every 10 years.”17
I do agree, however, that for many applications, exponential growth of a capability (such as memory size or processor speed) does not necessarily translate into exponential growth in utility. For many functions, it requires exponential growth in capability to obtain linear gains in functionality. It requires, for example, exponential gains in computing to obtain linear gains in chess ratings. Similarly, we see linear gains in the accuracy of pattern recognition algorithms (for example, speech recognition) with exponential gains in processor speed and memory capacity. However, for inherently exponential problems, linear gains in functionality and performance are very powerful and sufficient to obtain profound benefits.
Tuomi writes that “Exponential growth . . . is very uncommon in real world [sic]. It usually ends when it starts to matter.”18 It is clear, however, that the information industry (in all of its manifestations) has indeed begun to matter. Moreover, Tuomi provides no basis to conclude that exponential growth in computing has ended or is about to end.
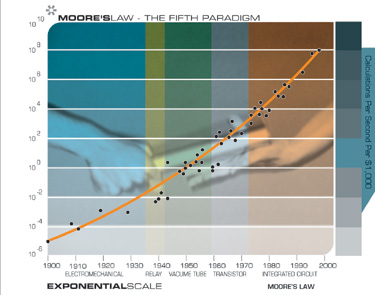
When we are unable to continue to shrink two-dimensional integrated circuits, we will build three-dimensional circuits. Note that this will not be the first paradigm shift in computing because Moore’s Law itself represented not the first but the fifth paradigm to provide exponential growth to computing. Prior to flat integrated circuits, we had electro-mechanical calculators, relay-based computing vacuum tubes, and then discrete transistors. Even though the semiconductor industry road map19 indicates that we have more than a dozen years left to obtain exponential growth through two-dimensional circuits, there has been enormous progress in recent years in developing early prototypes of three-dimensional circuits.
Based on our current understanding of the physics of computing, the inherent limits to exponential growth of computation and communication are extremely high (that is, the minimum matter and energy required to compute a bit or transmit a bit is extremely low).20 One of the most promising is to create general-purpose electronics using nanotubes, which are hexagonal arrays of carbon atoms. This approach has shown considerable promise in experiments. When fully developed, nanotube-based circuitry has the potential to be many orders of magnitude more powerful than flat integrated circuits. Even nanotubes do not approach the fundamental limits of computing, based on our current understanding of the physics of computation.
In Tuomi’s review of the industry’s history, he notes that on several occasions the industry just happened to be “saved” by special circumstances, for example, the emergence of the calculator and memory chip markets in 1965-68.21 Tuomi assumes that the industry was just lucky that the invention of these two product categories came at the right time. He writes that in general, “semiconductor technology has evolved during the last four decades under very special economic conditions.”22
But the introduction of new product categories made feasible by the greater price-performance of each new generation of semiconductor technology is inherently part of the process. More powerful chips, which have been occurring on a very predictable basis, lead to new product categories, which in turn lead to greater volumes.
The pace of this type of innovation has increased in recent years with the rapid introduction of new types of digital products. An inherent aspect of progress in information-based technologies is new paradigms on every level. Often, old problems are not solved directly, but rather are circumvented by the introduction of new paradigms, new applications, and new markets. But to Tuomi, the 50 years of exponential growth attributable to integrated chips (preceded by 50 years of exponential growth from pre-chip technologies) is all a temporary aberration.
It is important to point out that an evolutionary process – whether of technology or biology – is always a matter of special circumstances. However, there are always special circumstances. Whatever it was that hit the Earth that resulted in the demise of the dinosaurs was a special circumstance, one that had profound implications for all species at that time. But the progression of biological evolution was not dependent on that event just happening. In general, evolutionary events happen in “special” ecological niches that are inherently delicate and bounded by distinctive circumstances.
The “special circumstances” that Tuomi refers to in the semiconductor industry have kept Moore’s Law going for half a century, and counting. The acceleration of the price-performance of computation goes back at least a century. Special circumstances are part of the evolutionary process – not a reason to overlook its exponential progression. As Gilda Radner used to say on Saturday Night Live, “it’s always something” – meaning there is always something special about current circumstances.
Tuomi’s analysis is filled with strained analyses that stretch the data to make his contrarian points.
Consider his hand-drawn trend lines on the following graph23:
![]()
Tuomi’s Figure 3: Number of transistors on Intel microprocessors
Tuomi has drawn his chart in a misleading way. For example, it suddenly jumps up at year 21, yet this improvement is not taken into consideration. There are only two outlier points, both around years 20 and 21 (the “x” below the right point of the middle line, and the left most point of the right most line). If one draws a trend line through all of the points, leaving out these two outliers (which, in any event, cancel each other out), one gets a relatively smooth exponential chart. See my previous chart on the number of transistors in Intel microprocessors. Note that both Tuomi’s and my chart leave out the issue of transistor speed and the effect of many design innovations.
Tuomi includes less powerful processors at various points in time that skew the curve. There are always less-powerful versions of processors offered for special markets. The appropriate microprocessor to include at each point in time is the one providing the optimal performance. It is also worth pointing out that the number of transistors in a microprocessor is not the most relevant variable to measure. We are more concerned with the functionality per unit cost.
As noted previously, at some point, there will be an optimal number of transistors to perform the functions of a single processor. At that point, we won’t be interested in increasing the number of transistors in a microprocessor, but we will continue to be interested in improving price-performance. Above, I provided a properly constructed chart on transistors in Intel processors.
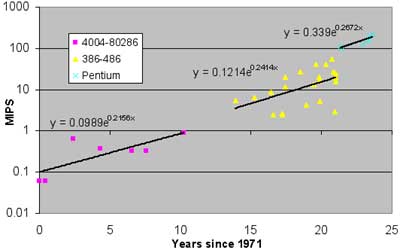
If we measure what is really important (overall processor performance), we need to consider speed improvements, among other factors. Tuomi himself provides evidence of the exponential speed improvement in his figure 4 above. Taking speed as well as design innovations into account, we get a doubling time of about 1.8 years for overall processor performance.24 This does not include the issue of word length, which has been increasing during this period. Including this factor would bring down the doubling time further.
)
Click for larger version
Remarkably, Tuomi prints a similar chart and concludes that “As can be seen from Figure 5, MIPS ratings of Intel processor have not increased exponentially in time.”25
Tuomi’s Figure 5: Processor performance in millions of instructions per second (MIPS) for Intel processors, 1971-1995.
His hand-drawn trend lines (on a logarithmic chart) show exponential growth, with the trend lines jumping up (meaning increased values) at two points. Each straight line on Tuomi’s logarithmic chart is an exponential, but as one goes across the chart (from left to right), each successive straight line (representing exponential growth during that time period) is at an even higher level.
How he can conclude that “this shows no exponential growth” is not explained.
Tuomi cites the following chart26 to make a point about the life cycle of a particular generation of chip:
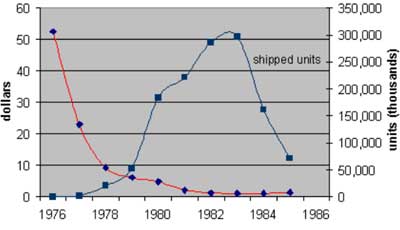
Tuomi’s Figure 1: Prices and Quantities of 16-kilobit DRAM chips. Source: Grimm, 1998
Tuomi makes the point that one can obtain misleading trends by taking price points at different times in the life cycles of different chips. But this criticism is not valid for any of the charts I have presented, nor those cited from other industry sources. The chart that I provided above for average cost per transistor is exactly that – the average cost for that year. In charts involving different types of chips, prices at the point of production are consistently used. There has been no attempt to compare one point in the life cycle of one chip to a different point in the life cycle of another chip.
However, let’s take a look at what happens if we examine the entire life cycle of multiple generations of semiconductor technology27:
![]()
Click for larger version
In this logarithmic chart, we can see the life cycle of each generation, and the overall exponential trend in the improvement of price-performance remains clearly evident.
Tuomi spends a lot of time in both papers talking about the “hedonic” model for economic value of various features and “quality” improvements such as increased memory or increased speed. He writes:
"…if a 100 MHz PC costs today 500 dollars more than a 60 MHz PC, we might assume that if a 100 MHz PC costs today as much as a 60 MHz PC a year ago, technical advance has been worth 500 dollars."28
The hedonic model has little validity. Current software may only make sense for the mainstream specifications, so purchasers would not be willing to pay very much for more memory than they need for the applications they have or intend to use. However, at a later time, when the more sophisticated applications available require more memory, they would be willing to pay for this extra memory, and in fact would not want the computer if it didn’t provide the memory (or other capabilities) necessary to run these applications. Furthermore, certain variations in specifications may appeal only to small niche markets. All of these factors distort this hedonic model methodology.
However, despite these methodological concerns, Tuomi himself cites numerous examples of exponential growth in price-performance based on quality-adjusted prices. He writes:
“The classic study of quality corrected prices in computing is by Chow (1967), who analyzed mainframe rental prices in the 1960s. According to Chow, quality-adjusted prices fell at an average annual growth rate (AAGR) of about -21 percent during the 1960-1965 period. Cole et al. (1986) studied the price declines of different computer components and found that over the 1972-1984 period, the AAGR for computer processors was -19.2 percent using the hedonic prices. . . .Cartwright (1986), in turn, reported an AAGR of -13.8 percent from 1972 to 1984. According to Gordon (1989), quality adjusted mainframe prices fell 22 percent annually from 1951 to 1984.”29
These are all exponential improvements cited by Tuomi. It should also be noted that during this time frame, mainframes started out as the best value, but were no longer remotely close to the best value by the end of the time period. Mainframes maintained artificially high prices to locked-in customers (who eventually escaped the lock-in to minicomputers and then personal computers). Nonetheless, even just considering mainframes, and an insufficient “quality adjustment” methodology, it still shows exponential improvement in price-performance. Tuomi continues:
“Triplett (1989) summarized earlier hedonic studies on mainframe computer prices and reported a ‘best-practice’ quality-adjusted price decline of -27 percent over the 1953-1972 time period. Gordon (1990) then extended his earlier analysis to personal computers and reported 30 percent annual declines from 1981 to 1987. Berndt and Griliches (1990) collected a large sample of data on personal computers and reported 28 percent annual decreases from 1982 to 1988.”
Note that a 30% decline each year = 51% decline (i.e., doubling of price-performance) in 2 years. 28% each year = 48.2% decline in 2 years, all examples of exponential growth.
Tuomi provides even further evidence of exponential improvement:
“Grimm has also calculated price indexes for microprocessors using the same methodology. For microprocessors the decline in price indexes has been considerably faster than for memory chips. During the 1985-1996 period, quality adjusted microprocessor prices dropped at an average annual rate of 35 percent.”
Note that an annual improvement of 35 percent is a doubling time (of price-performance) of less than 24 months. Also, the quality adjustment methodology, as I noted earlier, understates the values for the reasons I cited above. Tuomi’s conclusion is again to state the “the price decreases have not followed an exponential trend.” This conclusion is not consistent with the evidence that Tuomi provides in his own papers.
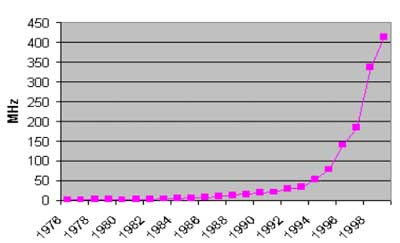
Tuomi consistently miscalculates these doubling times. For example, he writes:
“on average prices per unit of memory have declined 32 percent per year during the 1978 – 2000 period. This corresponds to a 30 month doubling time.”30
If prices drop 32 percent in one year, a price of $1 would be $0.68 after one year and $0.46 after two years (i.e., falling to less than half in 24 months). A 32 percent decline in price per year corresponds to a doubling time of under 22 months, not 30 months. He makes this mistake repeatedly, so Tuomi’s stated doubling times cannot be relied upon. Regardless of whether the doubling time is calculated correctly or not, this is one of many pieces of evidence cited by Tuomi himself of exponential improvement.
In Tuomi’s paper on my law of accelerating returns, “Kurzweil, Moore, and Accelerating Change31,” he describes my thesis as leading “to an apparently infinite speed of change.” I do want to clarify that exponential growth, even double exponential growth, does not lead to infinite rates of change. It nonetheless will lead to greatly transforming rates of change.
Repeatedly, Tuomi cites Moore’s change in description of what has become known as Moore’s Law from his 1965 paper, in which he cited a doubling time of transistors per dollar of one year, to his revised estimate in 1975 of two years. Tuomi describes this as Moore noting “that the speed of technical change was slowing down.” This is a mischaracterization. Moore simply corrected his earlier estimate to a more accurate one (one that has, incidentally, been conservative). He was not saying that it had been one year and was now becoming two years. He was saying that his earlier one-year estimate had been incorrect, and that it had been two years and would remain so.
As I mentioned earlier, when presented with the “forest” of a trend, Tuomi often responds with a comment about a missing branch of a tree. For example, in response to my chart on a century of double exponential growth in computing:
Tuomi responds that “Ceruzzi (1998:71,74) gives $1.6 to about $2 million as the price of a full IBM 7090 installation. Kurzweil uses $3 million. Kurzweil has also moved Babbage’s Analytical Engine about half a century in time, with the explanation that it probably could have been built in 1900. Other authors have argued the machine could have been built using available manufacturing capabilities.”
I would argue with both of Tuomi’s assertions, but even if one removes these two points, it hardly makes a dent in this forest of a trend.
My team of researchers has been adding additional points to this trend that corroborate this double-exponential trend. Note that a straight line on a logarithmic graph represents exponential growth, and that the exponential trend here is itself exponential – it took three years to double the price-performance of computing at the beginning of the twentieth century, two years in the middle, and it is now doubling approximately every one year.
Hans Moravec’s analysis32, which includes additional points from my own chart, also shows the same double-exponential trend:
)
Click for larger version
Tuomi also writes that “Historical data also reveals that the early computers rarely were working at their theoretical speeds.” This point only strengthens the observation that later computers were more powerful.
Perhaps the most convoluted argument that Tuomi presents is his discussion of the alleged lack of increased resources to the semiconductor industry. He writes “Technological developments in the semiconductor industry are generally viewed as the drivers of progress in computing. According to Kurzweil’s hypothesis, one would expect semiconductor industry to enjoy increasing positive returns that would speed up technical developments in the industry. Indeed, in Kurzweil’s model, the rapid technical developments would be caused by the increase in resources available for developers.”
Remarkably, Tuomi states that there have been no “accelerating increases in its resources.” Yet he cites a report from the World Semiconductor Trade Statistics (WSTS) that “the average year-to-year change in semiconductor shipment value during the 1958 – 2002 period is 18 percent.” This, of course, is exponential growth, so how does Tuomi justify his conclusion that I am incorrect in my assessment that the computer and information industries (which includes the semiconductor industry) have benefited from increased resources?
Tuomi provides this chart33:
)
Click for larger version
He takes the growth rate of the semiconductor industry and subtracts the growth rate of the U.S. GDP. This is a dubious proposition because the growth rate of the GDP is fueled specifically by technological innovation, particularly in information technologies. So we are subtracting from the growth rate of the semiconductor industry the growth rate of the economy. Yet it is the semiconductor and information technology industries that are primary contributors to the growth of the economy.
The result is nonetheless positive, which Tuomi calculates as averaging 10.8 percent annual growth (over the GDP growth). However, he then takes the derivative (slope) of this curve and notes that it is negative.
From this, he concludes that the semiconductor industry has not enjoyed increased resources. Yet, the industry has grown on average by 18 percent according to Tuomi’s own analysis, and this growth rate exceeds that of the overall economy to which it contributes. The appropriate conclusion of the negative slope in this complex graph is that the growth rate of the economy is catching up to the growth rate of the semiconductor industry. The reason for that is that information technology in general is becoming increasingly pervasive and influential. Information technology itself has gone from 4.2% of the GDP in 1977 to 8.2% in 1998, with the growth rate recently accelerating.34
)
Click for larger version
Moreover, information technology is increasingly influential on all aspects of the economy. Even those industries that are not explicitly “information technology” are nonetheless deeply influenced by it. We are rapidly moving towards an era in which the dominant portion of the value of most products is represented by their information content. Thus the overall economy is slowly catching up to the rapid growth rates of information-related industries such as the semiconductor industry, specifically because of the effect of these industries.
The bottom line is that resources have increased exponentially in the information technology industries, including the semiconductor industry, and this rate of growth is not slowing down. Moreover, this is the less important part of the story. The more important issue is not merely the increase in dollars, but the very rapid exponential growth of what each dollar buys.
Both hardware and software have increased enormously in power. Today, a semiconductor engineer sits at a powerful computer assisted design station and writes chip specifications in a high-level language. Many layers of intermediate design, up to and including actual chip layouts, are then computed automatically. Compare that to early semiconductor designers who actually blocked out each cell with ink on paper. Or compare that to the early computer designers who wrote out their designs by pen and then built the computers with individual components, wires and screwdrivers.
Tuomi cites the following graph to argue that computers and software investments have not been growing exponentially35:
)
Click for larger version
First of all, the data on figure 2 above matches a slow exponential more closely than a straight line, which does not match very well. The data starts under the line and ends up over the line.
More importantly, this graph is not plotting the actual computer and software investments, but rather expressing them as a percentage of private fixed investment, which is itself growing exponentially, reflecting the growth of the IT sector as a percentage of the GDP.
Tuomi writes that “. . .an exponential trend defines a technical trajectory that is independent of any external factors. Moore’s Law, in its original form, is basically such a claim. Its exponential form implies that. . .developments in integrated circuits are effectively independent of economic, organizational, social, or any other forces.”36
Tuomi here is misunderstanding the nature of exponential growth in information technology. The development of semiconductors and related computer technologies is not taking place in a vacuum. External factors are very much involved. This is a classical evolutionary process taking place in a competitive environment. If there were no economic value to increased capacities, they would not be developed. Greater capacities and price-performance lead to new capabilities and applications, which in turn result in increased demand. Moreover, the more powerful tools from one generation of technology create the next more powerful generation.
Tuomi’s argument becomes particularly strained when he discusses the purported benefits of analog computing. He writes, “Many mathematical problems that require an infinite number of algorithmic computations can be solved by intelligent humans and by non-algorithmic calculating machines. A classical technical method of doing this has been to use analog computers. Indeed, in many classes of mathematical problems the computational power of an analog computer is infinitely greater than the computation power of conventional digital computers.”
The above statements are illogical. “Humans and non-algorithmic calculating machines” are clearly not able to solve mathematical problems that “require an infinite number of algorithmic computations.” Moreover, the use of an analog computer certainly does not allow one to accomplish this.
It is also completely unjustified to say that an analog computer “is infinitely greater than the computation power of conventional digital computers.” This conclusion derives from the naïve notion that digital computers can only deal with “on” and “off,” and not with shades of gray in between. By using floating point numbers, digital computers can represent fractional values to any desired precision. In fact, digital computers are much more precise than analog computers in doing this.
Prior to World War II, analog computers were popular, and digital computers required the “digital” modifier to distinguish them. But analog computers are so unpopular today that we no longer are required to use the word “digital” before “computer.” Although an analog computer can represent a fractional value, the accuracy of analog components is relatively low and unpredictable. With a digital computer’s floating point numbers, the accuracy is known from the number of bits in the floating point representation.
If desired, one could use thousands of bits in each floating point number (the algorithms for doing this are well understood), which would provide accuracy far exceeding any conceivable analog process. Of course, for most practical applications, 32-bit or 64-bit floating point numbers are quite sufficient, and exceed the accuracy of existing analog computers.
There is an engineering argument that for some applications, such as precisely modeling the nonlinear aspects of human neurons, using transistors in their native analog mode is more efficient. California Institute of Technology Professor Carver Mead has pioneered this approach to doing neuromorphic modeling. There are counter-arguments to this: such analog chips are difficult to design and are not programmable. But regardless of how one settles this particular design issue, Tuomi’s statements about analog computers appear to have no basis.
In conclusion, every time I open the morning paper (which I now usually read online) and look at the specifications and prices in the ads for the latest digital phones, digital cameras, portable electronic games, MP3 players, digital TVs, notebooks, tablets, and pocket computers, among an increasingly diverse set of new product categories, I am reminded of the obvious exponential growth in price-performance that Tuomi insists on denying.
Further Detailed Response
I provide here a detailed response to specific assertions in Tuomi’s thesis. I encourage the reader to read Tuomi’s papers in full to obtain the full context of Tuomi’s statements.
Responses to Ilkka Tuomi’s
“The Lives and Death of Moore’s Law”37
Tuomi: Technical considerations of optimal chip manufacturing costs have been expanded to processor performance, economics of computing, and social development. It is therefore useful to review the various interpretations of Moore’s Law and empirical evidence that could support them.
Such an analysis reveals that semiconductor technology has evolved during the last four decades under very special economic conditions.
Kurzweil: Every paradigm has special conditions. Evolutionary change in either biology or technology always derives from finely tuned conditions and operates at the edge of survival (of a species or a product line).
Tuomi: Several observers have . . . . speculated about the possibility of "the end of Moore’s Law." Often these speculations have concluded by noting that Moore’s Law will probably be valid for at least "a few more generations of technology," or about a decade. An important example is the International Technology Roadmap for Semiconductors (ITRS), which now extends to 2016. This roadmap is generated by a global group of experts and represents their consensus. . . . it notes that within the next 10-15 years "most of the known technological capabilities will approach or have reached their limits."
Kurzweil: These well-publicized limits of Moore’s Law pertain to flat two-dimensional circuits only. Sometime during the second decade of this century, key feature sizes will be a small number of atoms in width, and we won’t be able to shrink them further. At these scales, these circuits are vastly more efficient than the cumbersome electrochemical signaling used in mammalian interneuronal connections, but only in 2-D. We live in a three-dimensional world, and it is clear that we will move into the third dimension. The research accomplishments underlying three-dimensional molecular computing are escalating rapidly, and are ahead of comparable points in history prior to other paradigm shifts. The entire paradigm of Moore’s Law (flat integrated circuits) was not the first but the fifth paradigm to provide exponential growth to computing – each time it became clear that a paradigm would end, research would intensify on the next paradigm.
Tuomi: Speculations on the extended lifetime of Moore’s Law are therefore often centered on quantum computing, bio-computing, DNA computers, and other theoretically possible information processing mechanisms.
Kurzweil: This is the wrong list. Quantum computing, bio-computing and DNA computers, if perfected, would be special-purpose devices. Although prodigious on certain classes of problems, they are not suitable for general-purpose computing. Quantum computing can in theory try every combination of qubit value simultaneously. So for the class of problems in which a solution can be easily tested, such as finding the factors of large numbers to break encryption codes, it is a great technology. But it provides no speed improvement for most conventional computing problems. The primary focus for the sixth paradigm of computing (after electromechanical, relay-based, vacuum-tubes, discrete transistors, and integrated circuits) is three-dimensional molecular computing. I have always favored nanotube-based designs, and these in fact have obtained the most advances in recent research.
Tuomi: The fundamental assumption was that the total manufacturing costs are practically independent of the complexity of the chips. For this to be the case, the engineering and design costs had to be so small that they could be neglected. Indeed, Moore noted that the costs of integrated circuits were totally dominated by packaging costs. In other words, the costs of silicon was fixed and knowledge was free and the only limiting factor in manufacturing costs was the rapidly increasing waste created by deteriorating yields. Moore’s discussion did not explicitly take into account investment costs.
Kurzweil: It is true that engineering of each new generation of chips has become more complex, but there have been countervailing trends that more than offset this. First, CAD sophistication (and the computers to run CAD software on) has substantially increased, allowing increasingly sophisticated chips to be developed in comparable time frames. Also, the number of chips produced in each generation has increased at an exponential rate, allowing development costs to be amortized over an increasingly large volume.
Tuomi: From an economic point of view, Moore’s Law was a rather fascinating law. It implied that the development of integrated circuits was completely determined by manufacturing costs. Moore’s Law, therefore, defines a completely new economy. In this economy, demand is infinite.
Kurzweil: Infinite? This is clearly an oversimplification. Nonetheless, demand has kept pace with continued exponential gains in memory size and computer capabilities, as evidenced by the exponential growth of the semiconductor industry (which Tuomi himself describes as being 18 percent per year) and the overall information technology industry. Below, Tuomi cites some examples of this as accidents that just happened to save the industry at various times. The reality is that the opening of new markets is inherently part of the process. There are many applications today that are waiting for the communication speeds, memory, and computational capacities of future years (such as ubiquitous full-immersion, visual-auditory virtual reality for business and personal encounters, augmented reality and telepresence applications, and many others).
Tuomi: The essence of Moore’s argument had been that it was becoming possible to manufacture increasingly complex integrated circuits and that the price per component was dropping radically. The limiting factor would be efficient amortization of design investments. This could be done in two basic ways: either by making high volumes of single function or by making designs that could be used for many different chips. The first path led to Intel’s focus on memory chips and the latter, a couple of years later, to microprocessors.
Kurzweil: Also by increases in chip volume created through new applications that result from the greater capabilities of each new generation of chip technology.
Tuomi: In his presentation, Moore analyzed the different causes of the exponential development. First, the physical size of the chips had been growing approximately exponentially. In 1975, chip sizes of the most complex chips were about 20 times larger than in 1959. Second, the miniaturization of component dimensions had also evolved at roughly exponential pace. This miniaturization had led to about 32-fold increase in component density in 15 years. The combination of increased chip size and component miniaturization therefore seemed to explain about 640-fold increase in the number of components. According to Moore’s prediction, however, in 1975 chips were supposed to contain more than 640 components. The remaining 100-fold increase Moore associated with "circuit and device cleverness". New technology, such as better isolation of components and innovations in circuit layouts had made it possible to pack more components closer to each other (Moore, 1975).
Kurzweil: Miniaturization of component dimensions results not only in more components per unit size, but also in faster circuits, since the electrons have less distance to travel. In addition, there is innovation on every level in both hardware and software. Beyond just packing more and faster circuitry onto each square millimeter, there have been many innovations in processor design, such as pipelining, register caches, parallel processing, more powerful instruction sets, etc.
Tuomi: Moore revised his original growth rate estimate and proposed that by the end of the decade, the number of components on the most complex chips would double about every two years. Soon after, this prediction became known as "Moore’s Law." According to Moore, the name was coined by Carver Mead (Yang, 2000).
Kurzweil: This was a revision, not an observation of the data changing.
Tuomi: In 1975, Moore implicitly changed the meaning of Moore’s Law. As he had done ten years before, he was still counting the number of components on semiconductor chips. Instead of focusing on optimal cost circuits, however, he now mapped the evolution of maximum complexity of existing chips. Indeed, in an article written a few years later, the famous growth curve is explicitly called "Moore’s Law limit" (Moore, 1979). At that point the growth estimate is presented as the maximum complexity achievable by technology. In Moore’s 1979 paper, which shows a picture with component counts of Intel chips manufactured in 1977 and 1978, most chips fall one, two, or even three orders of magnitude below this limit.
Kurzweil: Although Moore showed a chart like this, plotting the maximum complexity of chip technology at different points in time is not an appropriate way to measure performance. One has to measure performance on the most cost- effective implementation of computing technology at each point in time. So, for example, one would not just measure mainframe performance, because after minicomputers became established, mainframes were not the most cost-effective implementation. The same thing happened to minicomputers when personal computers became established. These older markets only persisted because customers were locked into legacy applications, but these were not the most cost-effective platforms.
Tuomi: . . . .in 1975.. . . Intel introduced the 16-kilobit CCD, the Intel 2416. In the same year Intel also introduced its 2116-chip, a 16-kilobit dynamic random-access memory (DRAM) chip. Such a chip would have contained somewhat over 16,384 transistors, including some control circuitry, and about 16,384 capacitors. Since the mid-1970s, complexity has been counted based on the number of transistors. Moore’s earlier calculations, however, were based on the total number of components.
Kurzweil: This is typical of Tuomi nit-picking. The reality is that regardless of whether one looks at number of components or number of transistors, there has been clear exponential growth.
Tuomi: Moore presented a new exponential growth curve in his 1979 paper. According to it, the man-hours per month required for integrated circuit production was also growing exponentially. Moore went on to note:
"If we assume that the cost in man-hours per month is inflating at 10 per cent per year (a conservative figure considering the need for increased computer support, software, etc.), then the costs double every two years … This cost can be contrasted with manufacturing costs, which are largely independent of device complexity. Whereas manufacturing costs were once dominant and exceeded those of design, the situation is now reversing, with design costs becoming dominant".
Kurzweil: One has to take into consideration the exponential growth in volumes that were also taking place.
Tuomi: Moore also noted that the problems that slowed down the growth of semiconductor complexity in the 1965-1968 period had not been solved. Engineers were still unable to design and define products that would have used silicon efficiently. Instead, the industry was saved by the invention of two product categories where these problems could be avoided. . . .The calculator was an important product because it was a relatively simple system. Merely connecting four integrated circuits (that had about 40 pins) created a calculator. The interconnection problem, therefore, was tractable. As calculators were produced in high volumes, the design costs could be justified. Memory chips, in turn, were easy to design and universal in their functionality, and therefore also high volume products with low design costs.
Kurzweil: Tuomi assumes that the industry just happened to be “saved” by the lucky invention of these two product categories. But the introduction of new product categories made feasible by the greater price-performance of each new generation of semiconductor technology is inherently part of the process. More powerful chips, which have been occurring on a regular basis, lead to new product categories, which in turn lead to greater volumes. The pace of this type of innovation has increased in recent years with the rapid introduction of new types of digital products. In addition, another inherent aspect of progress in information-based technologies is new paradigms on every level. Old problems are often not directly solved – they are circumvented by introducing new paradigms, new applications, and new markets.
Tuomi: Moore himself has noted:
"I never said 18 months. I said one year, and then two years … Moore’s Law has been the name given to everything that changes exponentially. I saw, if Gore invented the Internet, I invented the exponential" (Yang, 2000). The historically inaccurate 18 months doubling time has been extremely widely used. It is possible even to find fictive quotes of Moore’s 1975 presentation saying: "The number of transistors per chip will double every 18 months."
Kurzweil: Tuomi is correct that the 18 month figure is incorrect (for most measures). Moore never said it, and it does not match the data. Tuomi continues to beat this dead horse repeatedly in the rest of this paper.
Tuomi: As noted above, Moore never claimed that the number of components would double every 18 months. The first version, the doubling of components on a chip every year, would mean that the number of components would increase 1024-fold per decade. The second version, doubling every two years, would translate into a much more modest increase of 32 per decade. In fact, the International Technology Roadmap for Semiconductors (ITRS, 2001) uses as the basis of its near-term microprocessor forecasts three-year doubling time. A three-year doubling time means that the number of transistors on a chip increases about nine-fold in a decade.
Kurzweil: The ITRS roadmap shows doubling of the number of bits per DRAM memory chip every two years: 1 Gb in 2003, 2Gb in 2005, and so on up to 64Gb chips in 2015-2016. That represents a 24-month doubling time. If we factor in additional improvements, including faster switching time and anticipated lower chip costs, the doubling time in price-performance will be less than 24 months.
If one looks only at the reduction in feature size in the ITRS roadmap for microprocessors, one gets a doubling of capacity per mm2 in 36 months, but this is consistent with the rate of reduction of feature size going back to 1965. Despite this, the doubling time for the number of transistors per microprocessor has been 24 months, as I cited earlier. The cost per transistor has been coming down by half every 19 months. And when we factor in the increases in speed, the cost per transistor cycle has been coming down by half every 13 months.
It is also important to keep in mind that whereas increasing the number of bits in a memory chip increases its utility without limit, there is a limit to the number of transistors that are desirable in a microprocessor. At a certain level of complexity, we would rather concentrate on reducing the cost per microprocessor and using multiple processors than to continue adding complexity to a single processor. The same consideration does not apply to DRAM. When all of these factors are considered, the doubling time for price-performance for microprocessors in the ITRS roadmap is less than 24 months. Intel’s own roadmap is somewhat more aggressive than ITRS.
Tuomi: Over several decades the differences obviously increase dramatically. During the four decades of validity often claimed for Moore’s Law the difference between one-year and three-year doubling time means about eight orders of magnitude. In other words, to get the same number of transistors, the slower growth path would require us to buy 100 million chips, instead of one. So, although a few months more or less in the doubling rate might not appear to be a big deal, actually it is.
Kurzweil: As I pointed at the beginning of my response, there is no confusion between one-year and three-year doubling times. The trends have been very consistent and both the ITRS and Intel road maps project the same rate of exponential growth out through 2016. Whether one gets a 12 month doubling time or a 36 month doubling time depends on what is being measured. If one looks at a single issue such as line width, one gets longer doubling times. If, however, one considers the multiple levels in which innovation takes place, the doubling times are closer to 12 months.
Tuomi: As specific chip types usually have a long lifetime during which the costs and other parameters of the chip change, the ITRS roadmap differentiates four main life-cycle phases. The first is the year of demonstration. This is the year when the feasibility of a specific characteristic, for example the number of transistors on a single chip, is first demonstrated. The second phase, market introduction, usually two or three years later, is defined to occur when the leading manufacturer ships small quantities of engineering samples. The third phase, production, is defined to occur when the leading manufacturer starts shipping the chip in volume quantities and a second manufacturer follows within three months. The lowest cost phase emerges when the production processes have been optimized and competition does its work. For example, the 1-gigabit DRAM was demonstrated in 1997, introduced in 1999, and is expected to be in volume production in 2003. Similarly, the Intel Itanium processor was announced in 1994, was originally planned to be on market in late 1997, but was delayed and became commercially available in 2001. Market researchers currently project that Itanium will garner less than 10 per cent of the market for server computing in 2007 (Markoff and Lohr, 2002).
Kurzweil: Valid methodologies consider the most cost-effective form of memory or processor at each point in time. Obviously one can obtain invalid results by failing to do this. Tuomi makes this mistake later in this essay by concentrating on mainframe trends way past the point that mainframes represented the most cost-effective method of computing. In addition, graphs of processor speeds and density use the date of production so we can compare consistent points in development of each device.
Tuomi: Using this data we can fit an exponential growth curve and see how good the fit is. . . . . According to this simple fit, there were some five million transistors missing from Pentium II in 1997, representing about 70 per cent, and some 7.5 million, or some 18 per cent, too many in the Pentium 4 in 2000. The estimate for Pentium 4 comes relatively close to its actual value as the data, indeed, has been used to fit the exponential, and the final point is heavily weighted. The error would be greater if we were to use previous points to fit the curve and then predict the number of transistors of Pentium 4.
Kurzweil: Tuomi concentrates here on variances of the actual curve (which is clearly exponential and has about a 24 month doubling time) to a “predicted value.” This is irrelevant. It is true that many observers quote an 18 month doubling time for price-performance. 18 months happens to be approximately correct for the price per transistor (we get 19 months), but not accurate for the number of transistors per microprocessor. There seems to be little point in repeatedly making this point. Tuomi is clearly not demonstrating a lack of exponential growth.
Tuomi: One problem . . . . is that the clock speed is not directly related to the amount of information processed. For example, the original Intel 8088 PC microprocessor took on average 12 clock cycles to execute a single instruction. Modern microprocessors can execute three or more instructions per clock cycle.
Kurzweil: The improvements that Tuomi cites only serve to accelerate improvement further. One could also add increases in word and instruction sizes (from 4 bit to 8 to 16 to 32 to 64 to 128) and other improvements.
Tuomi: With the understanding that the clock frequency does not really measure processor performance, one may, however, check how clock frequency has evolved during the lifetime of microprocessors. Information on average processor clock speeds has been collected by Berndt et al. (2000). This is shown in Figure 4 (see above) on processor speed. The data covers distinctly identified personal computers that have been marketed and sold in the U.S. Processor speeds for mobile computers are excluded from Figure 4.
Figure 4 has several interesting characteristics. First, it should be noted that the data do not directly represent advances in microprocessor technology. It is based on computers that have been marketed to end customers. In that sense it does reflect changes in the actually available processing power. As can be seen from the Figure, until the end of 1980s the increase in the reported processor speed was quite modest. During the first decade, processor speed grew about four-fold and between 1986-1995 somewhat less than 10-fold. In about 1994, the clock speed started to grow much more rapidly.
Kurzweil: Tuomi’s chart 4 (see page 4 above) on processor speed is an exponential (and represents only one factor contributing to processor price-performance).
Tuomi: By 1985, then, demand had started to be less than infinite and the semiconductor industry was not endogenously driven by technology. In 1982, the increase in MIPS ratings stopped for about three and half years instead of following an exponential trend.
Kurzweil: This is not true if one looks at Tuomi’s own chart (see Tuomi’s figure 5 earlier in this essay). Although he does not place any points on the chart during 1982-1985, the points starting in 1985 are at an even higher level than would be expected by extrapolating the 1970-1982 trend line to 1985.
Tuomi: During the last decades, computer clock frequency and the number of instructions per second have become very inaccurate indicators of processor power. Since the Intel 80286 processors shipped in 1982, microprocessors have utilized parallel processing in many alternative forms. By parallelism, more operations can be accomplished within a time unit. For example, the processor can be loaded with instructions that contain several operations, it can have several execution units that process multiple instructions within one cycle, or the processing of operations can be started before the previous operations have finished. All these forms of parallelism have commonly been used since the mid-1980s.
Kurzweil: This is one of many innovations.
Tuomi: Moreover, since the 1990s, processor architectures have increasingly relied on program compilers that detect and optimize parallelism in the source code programs. Indeed, the innovations in compiler technology have been a main driver in processing power improvements.
Kurzweil: This is an unjustified oversimplification. It is only one of many factors.
Tuomi: Computing power is rarely determined by the capabilities of microprocessors. Usually, the microprocessor is connected to external memory and input and output devices with links that are an order of magnitude slower than connections within the chip.
Kurzweil: The capabilities of microprocessors are certainly important as one driving force. Communication busses have always been about an order of magnitude slower than communication within a chip. However, all of the various systems in a computer, such as the hard disk, the communication busses, and other devices, have benefited from exponential improvements in capability.
Tuomi: The attempt to develop measurement systems for computer processing power have made it clear that the definition of computing power depends on the tasks for which the computer is used. Therefore there is no well-defined criterion or data for arguing that computer power would have increased exponentially. On the contrary, it has frequently been argued that most of the increase in computer capabilities has been consumed by software. This is often formulated as Wirths law: "Software gets slower faster than hardware gets faster".
Kurzweil: Try going back and using old software to do common contemporary tasks. We quickly get used to, and rely on, new features and capabilities.
Tuomi: Clearly, there have been huge qualitative changes in desktop computers during this time. The problem, then, is how to take them into account.
One approach is to create so-called matched-model price indexes. It is possible to measure price changes of a given computer type across several years and deduce from this the actual price change. So, instead of looking yearly changes in the list price of desktop computers, .. . we can look how the price for a given PC configuration has changed.
Kurzweil: This is not appropriate because a given model of computer does not necessarily remain the best value model.
Tuomi: A complete personal computer contains several different types of chips and other components, such as hard disk drives, CR-ROM drives, a keyboard, and a displays. Price changes in PC, therefore, reflect quality changes in several different types of technologies. The hedonic estimation models, however, tend to break down when new components and functionality are added to computers. When notebook computers started to become important towards the end of the 1980s, the different existing technical characteristics became revalued. For example, more memory perhaps meant progress for desktop users but for notebook users it implied shorter battery lifetime or the need to stay close to the power plug when using the computer.
Kurzweil: Battery life for a notebook computer has not decreased. Fuel cells are on the way, with dramatically improved battery (fuel cell) life. NEC is introducing fuel-cell-powered notebooks in 2004.
Tuomi: . . . .recent growth may reflect increase in cost-adjusted performance. For example, architectural changes in microprocessors during the second half of the 1990s moved much of the external and expensive cache memory onto the processor chip. On the other hand, the rapid improvements in average PCs sold might also reflect, for example, availability of consumer credit and funding for information technology intensive firms.
Kurzweil: This reflects the increase in the number of chips that have been produced, which represents another exponential trend.
Tuomi: Price changes, of course, reflect market competition, imbalances in supply and demand, technical change, and new markets that open as new uses are found for technology. These have very little to do with the original formulations of Moore’s Law. Yet, one may ask whether the current economic evidence supports the claim the cost of computing halves every 18 months.
Kurzweil: Tuomi is really stuck on beating this dead horse. The doubling time (of price-performance or other measurement) depends entirely on what is being measured. Some in fact are 18 months, others range from under 12 months to 36 months. The 36 month categories, however, do not reflect price-performance.
Tuomi: The change in the average values as well as the yearly fluctuations show that the price decreases have not followed an exponential trend. The great differences between the results of the different modeling exercises show that we do not know how quality-adjusted computer prices should be measured or how they have changed during the last decades.
Kurzweil: Tuomi’s statement, “the price decreases have not followed an exponential trend,” is a remarkable conclusion. His own paper provides myriads of exponential trends. This conclusion defies common sense and ignores reams of data that can be looked at in many different ways, all of which show exponential trends in price-performance, and other measures of capability.
Tuomi: In the previous sections we have reviewed the original formulations of Moore’s Law and its revisions. We found that Moore changed his interpretations of Moore’s Law during the 1960s and 1970s, and that its subsequent extensions have added qualitatively new and important aspects to it. Whereas the original formulations of Moore’s Law focused on counting components on integrated circuits, its extensions made claims of exponential increase in processing power and exponentially dropping quality-adjusted prices of computing. We reviewed the available empirical evidence for these different versions of Moore’s Law and found that they have little empirical support. Semiconductor technology has not developed according to Moore’s Law. The claims that future developments in semiconductors, computer technology, or information processing would be determined by the continuation of Moore’s Law are, therefore, obviously invalid.
Kurzweil: The above statements only make sense if one interprets Moore’s Law as strictly being the 18 month statement. Tuomi is correct that the 18 month version that is often quoted is not correct – but to imply that there is no exponential trend in computing and semiconductors has no validity.
Tuomi: Here, of course, the industry dynamics play an important role. For example, computers require software. One of the important drivers for buying increasingly powerful computing equipment has been that new versions of operating system and application software have typically demanded more processing power. Although it seems clear that today personal computers are much more functional than twenty years ago, it is not clear how much more functional they are.
Kurzweil: For many applications, linear improvement requires exponential gains. For example, we need exponential gains in computing power to get linear gains in chess scores. This assumes we hold the software constant. Recent progress in the software of terminal-leaf evaluation in the minimax algorithm shows that improvements can be gained from software alone. However, linear progress in what are inherently exponential problems is very powerful.
Tuomi: The regular doubling and exponential growth that underlies the different versions of Moore’s Law implies a very unique claim. It fundamentally says that the described phenomenon grows purely based on its internal characteristics. Exponential growth means that after the growth speed is set, the future unfolds based on nothing but the current state of the system. Contrary to what some commentators of Moore’s Law have claimed, exponential growth is not uncommon. When we put money on a fixed interest rate account, and reinvest the returns, it will grow exponentially. In this sense, a bank account is a prototype of self-determined endogenous growth. Exponential growth, however, is very uncommon in real world. It usually ends when it starts to matter.
Kurzweil: Tuomi provides no basis to conclude that exponential growth in computing has ended or is about to end. As mentioned earlier, the inherent limits to exponential growth of computation and communication are extremely high (that is, the minimum matter and energy required to compute a bit or transmit a bit is extremely low).
Tuomi: During its history, the semiconductor industry has several times hit the speed limit. First it was bailed out by the digital clock and calculator industry, then by mini and mainframe computer industry. In the mid-1980s, just when no one seemed to be able to make a profit, the IBM PC and Microsoft saved the day.
Kurzweil: Bailed out? This is the inherent process of innovation powering these exponential trends. The number of such “saves” (in Tuomi’s terminology) is increasing. We recently have cell phones, digital cameras, PDAs, portable game machines, MP3 players, pocket computers, and many other new categories.
Tuomi: It is . . . . no surprise that semiconductor industry has not actually followed an exponential growth trend.
Kurzweil: This is a remarkable conclusion that does not follow even from his own reasoning. His own paper is filled with exponential trends, even if most are not 18 month doubling times.
Tuomi: As the size and importance of computer and information processing technologies now is becoming more than a couple of percents of national economies, it can be predicted that the endogenous growth in this industry cluster is about to end. The imbalance between supply and demand shifts and the social basis of demand makes itself increasingly visible. The open source movement, for example, effectively disconnects the economics of operating systems from the economics of semiconductor manufacturing, thus splitting the industry cluster in half.
Kurzweil: This is a big leap, with no support to land on.
Tuomi: In reality, the belief in rapid development has often paid off. Discontinuous innovations have created new uses and markets for semiconductors and have produced an expanding market. Instead of filling a market need, the semiconductor industry has actively and aggressively created markets. At times the aggregate market has grown at a speed that has appeared to be almost infinite in relation to existing manufacturing capability.
Kurzweil: These references to “infinite” demand make no sense. Nothing is infinite in today’s world of technology.
Tuomi: The rapid growth of semiconductor industry, therefore, has not been driven simply by technical advance in semiconductor industry. Although the aggressive pricing policy has facilitated the wide use of semiconductors, the high demand for semiconductor technology has fundamentally reflected a continuous stream of innovations that have occurred outside the semiconductor industry. In other words, the apparent explosive big bang in semiconductor technology is also an illusion.
Kurzweil: Tuomi’s statement that “the apparent explosive big bang in semiconductor technology is . . . an illusion” is another remarkable conclusion.
Tuomi: . . . .many discussions on the future of Moore’s Law have focused on physical limits. In recent years economic considerations have gained legitimacy also in this context, partly because Moore himself has frequently predicted that the increases in chip complexity will not be limited by physics but by the exponentially increasing costs of manufacturing plants.
Kurzweil: Three-dimensional methodologies promise to reverse this – new approaches use self-organizing methods to allow many faulty components in a system.
Tuomi: As computing technology becomes increasingly pervasive, we eventually have to ask what benefits it actually brings. Fundamentally, this question can only be answered in a theoretical framework that is able to define development. In theory, there are many different ways to approach this question, both old and new. It should, however, be clear that development cannot be reduced to shrinking line-widths, maximum number of components on a chip, or minimal manufacturing costs.
Kurzweil: These remain, nonetheless, powerful driving factors, although it is correct to say that there are other factors of innovation. Moreover, exponential growth is not limited to memory or MIPS, but includes essentially all information-based technologies. Other examples include magnetic disk density (a completely independent phenomenon), telecommunication speeds and price-performance, DNA sequencing, brain reverse engineering, human knowledge, and many others.
Responses to Ilkka Tuomi’s “Kurzweil, Moore, and Accelerating Change” 38
Tuomi: As Moore noted, on average integrated circuit component counts grew rapidly during the 1960s, almost with a one-year doubling time. During the first decade of microprocessors, the transistor counts grew at about 22 months doubling time, when measured using a least squares trend, which slowed to about 33 months during the following decade. During the 1990s, transistor counts grew at varying speeds. In the Intel’s Pentium chips, the transistor counts grew with around 54 month doubling time. After that the transistor counts grew very rapidly, partly because large amounts of memory were added onto microprocessor chips (Tuomi, 2002b).
Kurzweil: As noted earlier, Tuomi’s 54 month doubling time is not consistent with the historical data, as indicated in the graph on transistors in Intel microprocessors provided earlier. There are always less capable processors offered than the current standard, so including these on the chart only serves to skew the results.
More importantly, measurements related to processors, whether transistor counts, or MIPS ratings, are not the most meaningful items to measure. We are more concerned with performance per unit cost. Also note that MIPS measure does not take into consideration word size. Since word sizes have increased over time, there has been even greater progress than the MIPS ratings alone would suggest. See my graph above on processor performance (MIPS).
Tuomi: Alternative growth rate estimates can be based simply on transistor counts on representative microprocessors introduced at two points of time. If we use the first microprocessor, Intel 4004, as a starting point, the exponential growth time for the 1971-82 period is 21 months, for the 1971-91 period 26 months, and for the 1971-98 period 27 months.This calculation indicates a slowing down in the component growth rate. If we separately calculate the growth rate for the 1982-91 period, it is about 35 months, and for the 1991-98 period somewhat over 30 months. It therefore appears that during the first decade of microprocessors component counts increased much more rapidly than during the 80s. In the 1990s the growth rate was faster, 30 months for both the first half and the whole 1990-1998 period, but considerably slower than during the first decade of the microprocessor history.
Kurzweil: These numbers are also dubious, but even less relevant than MIPS ratings. There is an optimal number of transistors for the functionality of a processor for a given word length and instruction set, so measuring the number of transistors is not the most appropriate measure of the exponential growth of price-performance. Nonetheless, there has been exponential progress on this measure. See my graph above on transistors in Intel processors.
Tuomi: If one studies the share of inputs that are used computer manufacturing in the US, one can see that the biggest input cost is associated with wholesale trade (about 14 percent of total output) and semiconductor devices (also about 14 percent). This is followed by payments for other electronic component manufacturing, software publishers (about 9.5 percent), computer storage device
manufacturing, computer peripheral manufacturing, internal sales in the computer industry, and management consulting services. A more detailed study reveals that computer manufacturing requires such inputs as air transportation, computer terminals, sheet metal work, and food services and drinking places. The average price changes in the 1990s are greatly influenced by the extremely rapid drop of prices in the second half of the decade. For example, the semiconductor input prices in the computer industry dropped over 40 percent annually during 1995-99. In the first half of the decade, however, they declined only 11 percent annually.
Kurzweil: This is all irrelevant. We are concerned with what the computer industry has been able to accomplish in terms of price-performance, not in measuring what they pay for their “inputs,” such as “food services and drinking places.” We see exponential improvement in all facets of computer price-performance: MIPS per dollar, RAM capacity, hard disk capacity, and other features.
Tuomi: A reasonable estimate for the average annual decline in quality-adjusted computer prices is probably about 18-30 percent during the last couple of decades, which corresponds to 2.6 to 4.2 year “doubling times.”
Kurzweil: As I cited above, Tuomi makes this mistake repeatedly. A 30 percent decline in price means a price of 70% (of the original price) after one year, 49% after two years. Thus the price has fallen to less than half in 2 years, so the doubling time is less than 2 years, not 2.6 years. This consistent error is significant since Tuomi is citing “high” doubling times as evidence that estimates of 2 year doubling times are not accurate. Of course, the doubling time depends entirely on what one is measuring.
Tuomi: Clouds are continuously changing their form. The ripples on a stormy sea encode huge amounts of information. Any argument about speed of change therefore has to neglect most sources of change. The selection is obviously made by relevance. When we say that the evolution is progressing at an accelerating pace, we have to abstract away all change that doesn’t matter. 20 Which sources of change are left out of the equation depends on our present interests.
Kurzweil: Tuomi is missing the entire point of the law of accelerating returns, which pertains to exponential growth of the capacity and price-performance of information-based technologies. It is not my position that all exponential trends go on indefinitely.
Indeed, exponential trends do hit a natural limit, but the key point is that the known limits for computation and communication are extremely high, vastly exceeding current technology. When I refer to a paradigm shift (such as integrated circuits, or the Internet), I am not referring to any type of change, such as “clouds . . . . changing their form,” but rather technological methods that provide for the continuation of the exponential growth of the capacity and price-performance of an information related technology.
Notes
1 Tuomi, Ilkka, "The Lives and Death of Moore’s Law." First Monday, volume 7, number 11 (November 2002). http://firstmonday.org/issues/issue7_11/tuomi/index.html.
2 Ibid.
3 Ibid.
4 Ibid.
5Intel Corp. and The International Technology Roadmap For Semiconductors: 2002 Update, International SEMATECH, 2002. http://public.itrs.net.
6 Microprocessor Quick Reference Guide. Intel Research. http://www.intel.com/pressroom/kits/quickrefyr.htm. Gregory Allen has also addressed similar issues in a mathematical analysis of microprocessor performance growth ("The Bit Flip Rate, Frequency and Transistor Density Equations," private communication, 2003). He agrees that the "bit flip rate" of microprocessors and transistor density are growing exponentially.
7 Data from Dataquest and Intel reports.
8 Cullen, Steve. "Semiconductor Industry Outlook." Instat/MDR. 2003.
9 Tuomi, Figure 4.
10 1976-1999: E.R. Berndt, E.R. Dulberger, and N.J. Rappaport, 2000. "Price and quality of desktop and mobile personal computers: a quarter century of history," 17 July 2000. http://www.nber.org/~confer/2000/si2000/berndt.pdf. 2001-2016: The International Technology Roadmap for Semiconductors: 2002 Update. On-Chip Local Clock: Table 4c Performance and Package Chips: Frequency On-Chip Wiring Levels-Near-term Years (Update), page 167
.
11 Average transistor price: Dataquest/Intel. Microprocessor speeds: 1976-1999: E.R. Berndt, E.R. Dulberger, and N.J. Rappaport, 2000. "Price and quality of desktop and mobile personal computers: a quarter century of history," 17 July 2000, http://www.nber.org/~confer/2000/si2000/berndt.pdf. 2001-2016: The International Technology Roadmap for Semiconductors: 2002 Update. On-Chip Local Clock: Table 4c Performance and Package Chips: Frequency On-Chip Wiring Levels-Near-term Years (Update), page 167.
12 http://www.ii.uni.wroc.pl/~jja/ASK/HISZCOMP.HTM, http://www.siliconspirits.com/scomputer.html, http://www.seagate.com/cda/products/discsales/index, Byte magazine advertisements, 1977-1998, PC Computing magazine advertisements, 3/1999, Understanding Computers: Memory and Storage Time Life Editors. Time Life, 1990.
13 Internet Software Consortium, http://www.isc.org/ds/host-count-history.html
14 Trajtenberg, Manuel. Economic analysis of product innovation: the case of CT scanners. Cambridge, MA : Harvard University Press, 1990; Michael H. Friebe, Ph.D., President, CEO NEUROMED GmbH (email)
15 "GenBank Statistics," GenBank, National Library of Medicine, August 15 2003, http://www.ncbi.nlm.nih.gov/Genbank/genbankstats.html
16 See discussion in my essay “The Law of Accelerating Returns”
17 Tuomi, Ilkka, “Kurzweil, Moore, and Accelerating Change.” Ilkka Tuomi
Curriculum Vitae. European Commission Joint Research Centre. http://www.jrc.es/~tuomiil/moreinfo.html.
18 Tuomi, Ilkka, "The Lives and Death of Moore’s Law." First Monday, volume 7, number 11 (November 2002). http://firstmonday.org/issues/issue7_11/tuomi/index.html.
19 The International Technology Roadmap For Semiconductors: 2002 Update, International SEMATECH, 2002. http://public.itrs.net.
20 Fredkin, Edward, “A Physicist’s Model of Computation,” Proceedings of the 26th Recontre de Moriond, 1991. http://www.digitalphilosophy.org/physicists_model.htm.
21 Tuomi, Ilkka, "The Lives and Death of Moore’s Law." First Monday, volume 7, number 11 (November 2002). http://firstmonday.org/issues/issue7_11/tuomi/index.html.
22 Ibid.
23 Ibid.
24Intel Corp.
25 Tuomi, Ilkka, "The Lives and Death of Moore’s Law." First Monday, volume 7, number 11 (November 2002). http://firstmonday.org/issues/issue7_11/tuomi/index.html.
26 Tuomi, Figure 1
27 The International Technology Roadmap For Semiconductors: 2002 Update, International SEMATECH, 2002. http://public.itrs.net.
28Tuomi, Ilkka, "The Lives and Death of Moore’s Law." First Monday, volume 7, number 11 (November 2002). http://firstmonday.org/issues/issue7_11/tuomi/index.html.
29 Ibid.
30 Tuomi, Ilkka, “Kurzweil, Moore, and Accelerating Change.” Ilkka Tuomi
Curriculum Vitae. European Commission Joint Research Centre. http://www.jrc.es/~tuomiil/moreinfo.html.
31 Ibid.
32 Moravec, H., "When will computer hardware match the human brain?" Journal of Transhumanism, Vol 1, (1998)
33 Tuomi, Ilkka, "The Lives and Death of Moore’s Law." First Monday, volume 7, number 11 (November 2002). http://firstmonday.org/issues/issue7_11/tuomi/index.html.
34 U.S. Department of Commerce statistics, 1997-1998.
35 Tuomi, Ilkka, “Kurzweil, Moore, and Accelerating Change.” Ilkka Tuomi
Curriculum Vitae. European Commission Joint Research Centre. http://www.jrc.es/~tuomiil/moreinfo.html.
Figure 2.
36 Ibid.
37 All of Tuomi’s statements in this section are taken from his "The Lives and Death of Moore’s Law." First Monday, volume 7, number 11 (November 2002). http://firstmonday.org/issues/issue7_11/tuomi/index.html.
38 All of Tuomi’s statements in this section are taken from his “Kurzweil, Moore, and Accelerating Change.” Ilkka Tuomi Curriculum Vitae. European Commission Joint Research Centre. http://www.jrc.es/~tuomiil/moreinfo.html.